CFO Dashboards – improving the CFO’s data analysis
As the CFO you’re constantly wanting live data about the business’s performance and Key Performance Indicators. Ask any CFO how much time they spend analysing the operational and financial data and they will undoubtedly tell you “most of the time.” Snapshot CFO Dashboards help Chief Financial Officers save substantial time and effort.
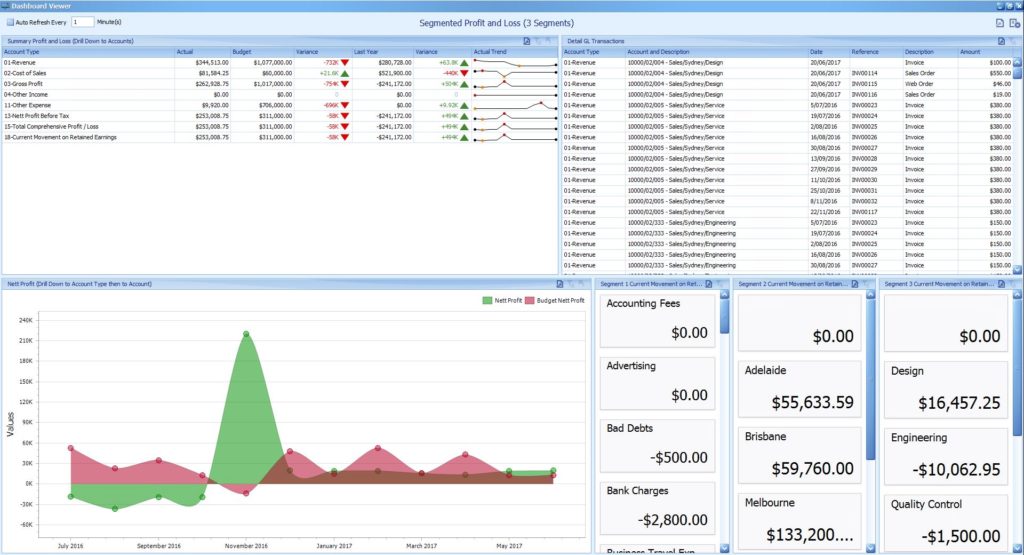
The P&L CFO Dashboard
A fast, efficient way to improve a CFO’s data analysis from a high level (with yearly & monthly results) all the way to the lowest level of individual transactions, is to use the real time P&L Dashboard. This dashboard provides a multitude of benefits for the CFO and other senior managers too.
Speed of data
Snapshot Liveprovides a graphical view of a company’s performance versus budget for any date range.
Any CFO will tell you there’s something about looking at the pattern of a graph and then being able to select a spot on that graph to analyse the result. As you click on different periods, the whole dashboard will dynamically change, quickly, to show you that periods performance.
The time savings in reviewing performance even on this simple level is significant. No re-running reports, exiting screens, just a click and the data can be analysed.
Drill down
With any CFO Dashboard in Snapshot Live, it’s easy to drill down into the data, whether that be 12 months, 7 months or one month is even easier. For example, let’s say we want to identify all the expenses in the company over the last 12 months higher than budget and higher than last year.
Double click the expenses line, and you will see each expense General Ledger GL account.
Now click the Variance column for Actual versus Budget, and the screen automatically shows you every expense that is greater than budget, sorted in order of the difference.
Likewise select the Variance from Last Year, and you will instantly see where costs are up against the previous year.
Interrogation now under control
Now when you’re asked by the CEO where expenses are increasing you can provide the facts and share that information too. Snapshot allows you to export to a variety of options including MS Excel, in about 1 minute. That’s if the CEO isn’t using the Snapshot Dashboard him or her self – that can be easily set up.
Drilling down further is easy too. Want to know why the Office Entertainment Account is $10,000 over budget, and $20,000 more than last year? Click on the account in the list, and in the right hand pane you can view the individual transactions that are in that account, for the time period selected.
Now you can easily see why the account is over budget and be able to explain to any CEO or board member.
Immediate financial analysis
This is only one example of the CFO Dashboard range within Snapshot. This P&L Dashboard delivers an immediate improvement in financial analysis and company wide dissemination of data where appropriate.
It’s easy to see Snapshot on your own data using our 30-day unconditional trial (click below) or ask for a demonstration. Happy to help any CFO!